By now, we have all seen the recent news about United Airlines forcibly removing a doctor from an overbooked flight. Almost every major publication has a story on how various airlines handle overbookings and the rules and regulations that come with it (hint: United doesn’t fare so well), but we wanted to look at the economics behind why airlines overbook.
At first glance, potentially having to pay as much as $1,350 in cash to remove a customer involuntarily from a seat that might have cost far less seems to go against the airline’s best interest. But if we take a more detailed look we can see why every airline overbooks to some extent.
What is a Toy Model?
In economics, we often construct “toy models”. These are very simplistic mathematical models that look to explain some economic behavior or phenomenon. In this case, we are considering the revenue generated by a flight and how that revenue changes with varying levels of overbooking.
Let’s consider some of the variables that would go into this model, like:
- Number of seats
- Price of each seat
- Likelihood that these seats will be bought
- Probability that a customer does not show up
- The cost of removing someone from a seat that is overbooked (may not be known)
- How much money customers who do not show up to their flight get refunded
- Type of flight (destination, length, etc.)
- And many, many more
Not only do we not know many of these variables, but our model would get hopelessly complicated. For right now, we want to simplify our model to just a few variables, so we are going to make some very important (and possibly unrealistic) assumptions:
- Every seat costs the same price
- All seats sell out
- The cost of removing someone from a flight is a constant value for each person
- Each individual has the same, known, probability of not showing up to a flight
With these assumptions we can create a very simple equation for the revenue of a particular flight.
At its most basic, Revenue = Price * Tickets Sold, where Tickets Sold is equal to the number of Available Seats plus the number of Overbooked Seats.
Cost of Overbooking
But then we have to account for the fact that if more people show up to the flight than there are seats available, the airline will have to pay some customers to leave the flight. We will call this the Cost of Removal. Airlines regularly offer up to $1,350 in cash to customers who are removed from flights. So the equation for the Cost of Overbooking looks like this:

Cost of Refunds
Finally, we have to account for the fact that customers who do not show up to their flight are often given a refund of some sort. Maybe it’s 50% of their ticket price, although it could be more or less. So we have to calculate the following:

Calculating Total Revenue
Given all these factors, we are left with the following equation:

We can then plug numbers into this model to tell us how much revenue a flight will make. Then we simply pick the level of overbooking that makes the most revenue.
A key point here is that the number of no-shows is not a deterministic number, it varies and the airlines can never know exactly how many people will be no-shows. But since we know the probability that an individual will be a no-show, we can use that to create a distribution of how many no-shows we expect in total. For those of you interested, this would be a Binomial distribution.
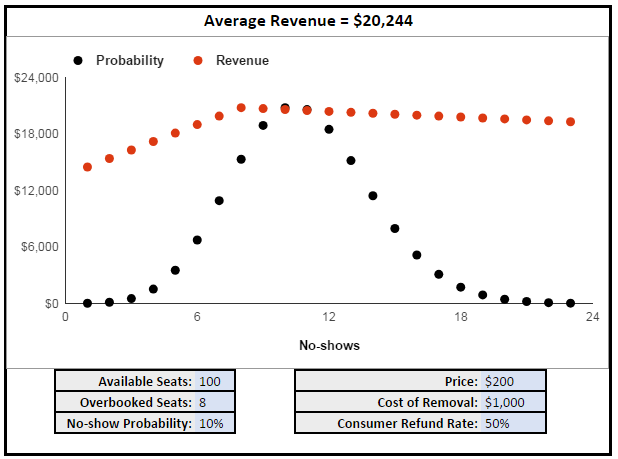
Let’s put this model to the test:

In the example above, the optimal number of overbooked seats for this flight is eight. If the airline were to increase or decrease that number, the average revenue would go down. For example, if the airline did not overbook at all, revenues would decrease to an even $19,000.
It turns out that even if we increase the cost of removal to something very high (say $100,000) it still makes sense for the airline to overbook (just to a lesser extent). Of course, this model doesn’t take into account other repercussions of overbooking and removing customers (like public relations scandals and impact on future demand for flights). This is a toy model after all!
Try It For Yourself
Feel free to adjust the numbers in the model to see how it affects the overall revenue and number of overbooked seats necessary to maximize profits.
The black data points represent the binomial distribution we talked about earlier, the probability that we will see a specific number of no-shows. The red data points represent the amount of revenue generated with that number of no-shows. The average revenue multiplies these values and adds them up.


