Data informs virtually every business decision an organization makes. Because of this, it’s become increasingly important for professionals of all backgrounds to be adept at working with data.
While data can provide immense value, it’s important that professionals are able to effectively communicate the significance of the data to stakeholders. This is where data visualization comes into play. By transforming raw data into engaging visuals using various data visualization tools, it’s much easier to communicate insights gleaned from it.
Here are six real-world examples of data visualization that you can use to inspire your own.
What Is Data Visualization?
Data visualization is the process of turning raw data into graphical representations.
Visualizations make it easy to communicate trends in data and draw conclusions. When presented with a graph or chart, stakeholders can easily visualize the story the data is telling, rather than try to glean insights from raw data.
There are countless data visualization techniques, including:
- Pie charts
- Bar charts
- Scatter plots
- Heat maps
The technique you use will vary based on the type of data you’re handling and what you’re trying to communicate.
6 Real-World Data Visualization Examples
1. The Most Common Jobs by State

Source: NPR
National Public Radio (NPR) produced a color-coded, interactive display of the most common jobs in each state in each year from 1978 to 2014. By dragging the scroll bar at the bottom of the map, you’re able to visualize occupational changes over time.
If you’re trying to represent geographical data, a map is the best way to go.
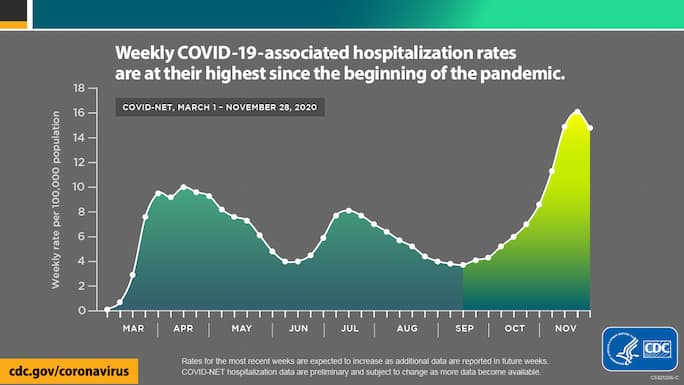
2. COVID-19 Hospitalization Rates

Source: CDC
Throughout the COVID-19 pandemic, the Centers for Disease Control and Prevention (CDC) has been transforming raw data into easily digestible visuals. This line graph represents COVID-19 hospitalization rates from March through November 2020.
The CDC tactfully incorporated color to place further emphasis on the stark increase in hospitalization rates, using a darker shade for lower values and a lighter shade for higher values.
3. Forecasted Revenue of Amazon.com

Source: Statista
Data visualizations aren’t limited to historical data. This bar chart created by Statista visualizes the forecasted gross revenue of Amazon.com from 2018 to 2025.
This visualization uses a creative title to summarize the main message that the data is conveying, as well as a darker orange color to spike out the most important data point.
4. Web-Related Statistics

Source: Internet Live Stats
Internet Live Stats has tracked web-related statistics and pioneered methods for visualizing data to show how different digital properties have ebbed and flowed over time.
Simple infographics like this one are particularly effective when your goal is to communicate key statistics rather than visualizing trends or forecasts.
5. Most Popular Food Delivery Items

Source: Eater
Eater, Vox’s food and dining brand, has created this fun take on a “pie” chart, which shows the most common foods ordered for delivery in each of the United States.
To visualize this data, Eater used a specific type of pie chart known as a spie chart. Spie charts are essentially pie charts in which you can vary the height of each segment to further visualize differences in data.
6. Netflix Viewing Patterns

Source: Vox
Vox created this interesting visualization depicting the viewing patterns of Netflix users over time by device type. This Sankey diagram visualizes the tendency of users to switch to streaming via larger device types.
Visualizing Data to Make Business Decisions
The insights and conclusions drawn from data visualizations can guide the decision-making and strategic planning processes for your organization.
To ensure your visualizations are relevant, accurate, and ethical, familiarize yourself with basic data science concepts. With a foundational knowledge in data science, you can maintain confidence in your data and better understand its significance. An online analytics course can help you get started.
Are you interested in improving your data science and analytical skills? Download our Beginner’s Guide to Data & Analytics to learn how you can leverage the power of data for professional and organizational success.
This post was updated on February 26, 2021. It was originally published on January 12, 2017.


